Visualisation of Source Code Repositories
Recently, I needed to do statistical analysis on a source code repository, and in the process, I experimented a bit with freely-available visualisation tools. Here is a cool visualisation of source code submission activity.
Visualising the Activity of Source Code Repositories
This tool, named gource (presumably a play on the words ‘graphics’ and ‘source’) and available for download from here, produces animations of temporal source code activity such as submissions of files, creation of new branches and folders, and who is modifying what. To run, one simply executes this command line utility from the root folder of the local repository.
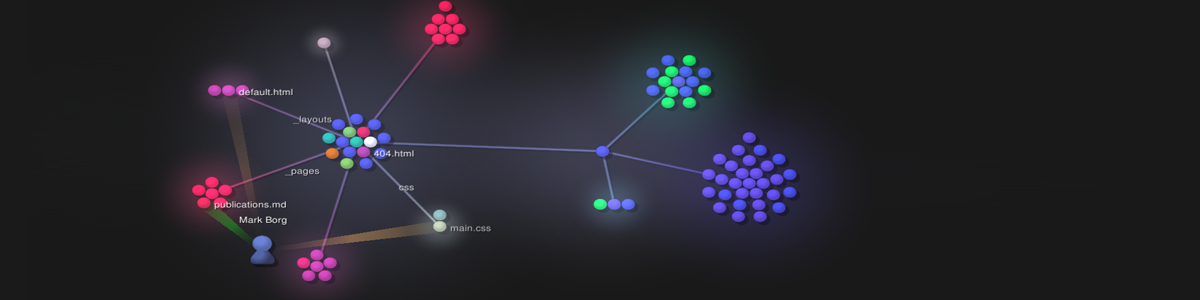
Below is a sample video showing the activity on the source code repository of this website. Because of video size limitations, this video only shows the activity on 3 different time periods.
In this case, it’s only me that is editing the stuff. But with a larger source code repository, interesting patterns of user activity can become visible with such visualisation tools. Combined with statistical analysis, a lot of interesting insights can be discovered about the behaviour, patterns, and efficiency of the code development process.
Other Visualisation tools
There are others beside Gource, such as CodeFlower and code_swarm.
Apart from visualisation tools working on source code repositories, we then also have those that work on the source code itself to visually highlight stuff like code and module dependencies, code patterns, static and dynamic analysis of code, etc. There are many free and open source tools, as well as commercial tools that fall within this category.
For example, Softagram performs static analysis on the code structure and dependencies, collecting metrics like commit counts and lines of code (LOC). It also has a number of visualisation features based on the dynamic analysis (execution) of the code. Similar tools include Flow that focuses on Java code, pfff, and many many more. Even standards such as UML and UML-based tools fall into this category.
I especially like ExTraVis and its rich visualisation functionality for exploring how a program behaves dynamically while executing. A screenshot of this great tool is reproduced below:

Machine Learning and Source Code Repositories
Apart from the visualisation tools like Gource, many statistcal and report generation tools are available for performing statistical analysis of the activity on source code repositories. For example, tools like pepper and Gitinspector.
Recently, Machine Learning is also being applied to this domain, to learn about source code repositories and about developers’ activities and behaviours on source code development and submissions. For those interested, the following paper makes for an interesting read.
Complementing this is work on applying machine learning for the analysis of the source code itself, such as source code classification. One such research group doing a lot of work in this area is called MAST from Edinburgh University.
The future might see more convergence between these two areas: machine learning and analysis applied to both the source code itself, as well as to source code repository as a whole. Adding to this, machine learning can also be applied to modelling a developer’s interaction with a source code repository, as well as the behavioural dynamics between the different developers contributing to the same repository. In conjunction with visualisation tools, this can bring about a new way of how we look at software development and hopefully also leading to improved software quality.