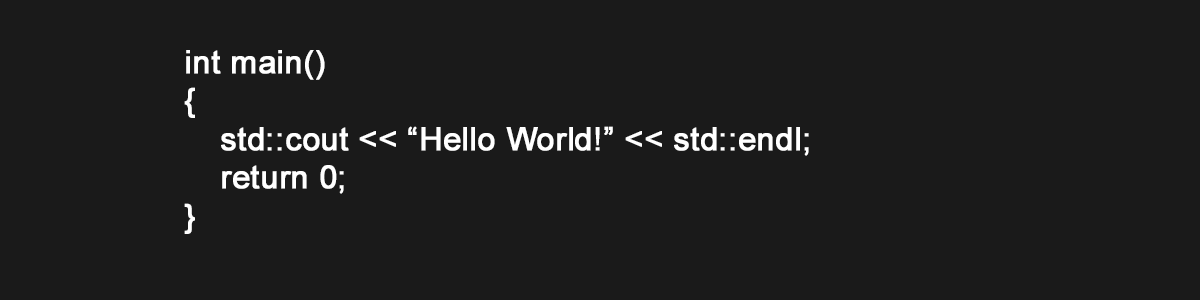
Hello World!
Welcome to my new blog!
This is my first blog entry. In the spirit of programming languages, and since at the moment I am learning R, I will dedicate this short blog entry to writing a Hello World in R. Writing it in a fancy way and exploiting the graphing capabilities that R offers.
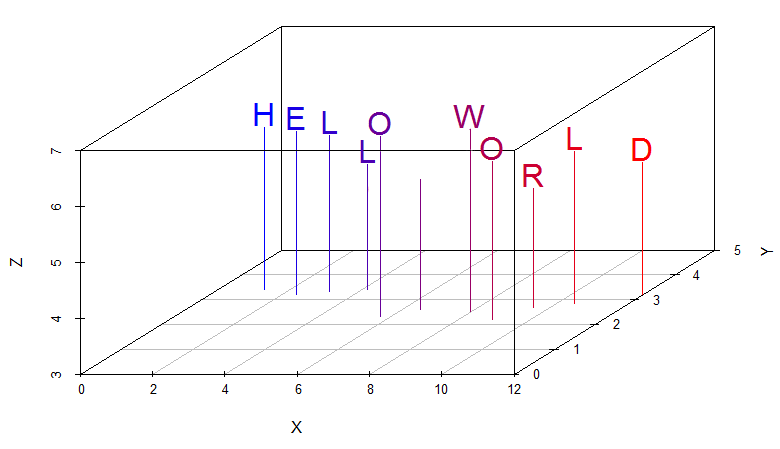
df <- data.frame(V = strsplit('HELLO WORLD', '')[[1]], X = 1:11 + runif(11), Y = runif(11, min=2, max=3.5), Z = runif(11, min=5, max=6))
require(scatterplot3d)
cols <- colorRampPalette(c("blue", "red"))(11)
s3d <- scatterplot3d(df[,-1], pch = '', color = cols, type = 'h', ylim = c(0,5), zlim = c(3,7))
s3d.coords <- s3d$xyz.convert(df[,-1])
text(s3d.coords$x, s3d.coords$y, labels=df$V, pos=3, offset=0.1, cex=2, col = cols)
The following is the output obtained:
R is an extremely powerful language that is useful for statistical computing and graphics. It is the language of choice for Data Science and can be used within many AI and machine learning frameworks and architectures, for example, the use of R within Azure Machine Learning.
Some good books on R that I am currently reading are the following:
 |
 |
 |