Blog
PhD finished!
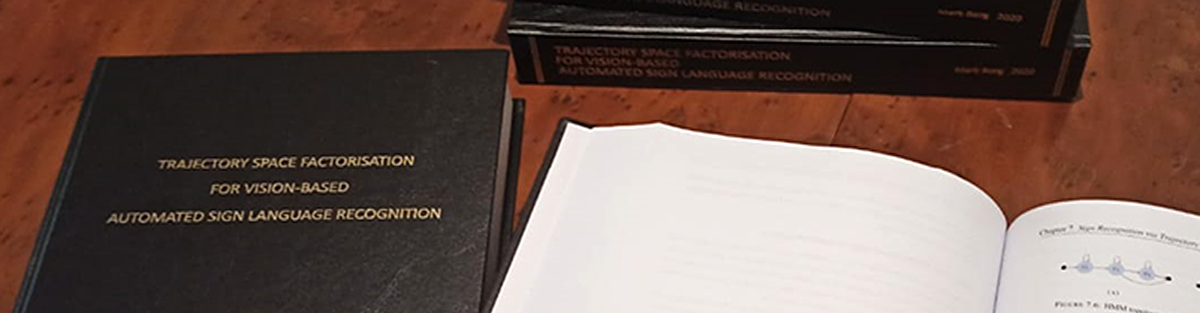
After a long journey filled with many sleepness nights, consumption of copious amounts of coffee, and much suffering, I finally managed to submit my PhD thesis. [read more]
Messaging between Python and C++ applications
I recently wanted to create an image-processing pipeline made up of a combination of C++ programs and Python scripts. Rather than integrating direct communication (or direct calls) within the applications, I wanted flexibility in the design of the pipeline to allow for experimentation. The solution was to make use of a messaging architecure and opted for RabbitMQ as the messaging broker. [read more]
AIMS2018 Presentation

Last month I had the opportunity to deliver a keynote presentation at the AI Malta Summit (AIMS 2018). The subject of the presentation was on how we can train AI to be ethical and unbiased. [read more]
Image Noise Modeling
A common assumption underlying many computer vision algorithms is that image noise is normally distributed. But is this a valid assumption? [read more]
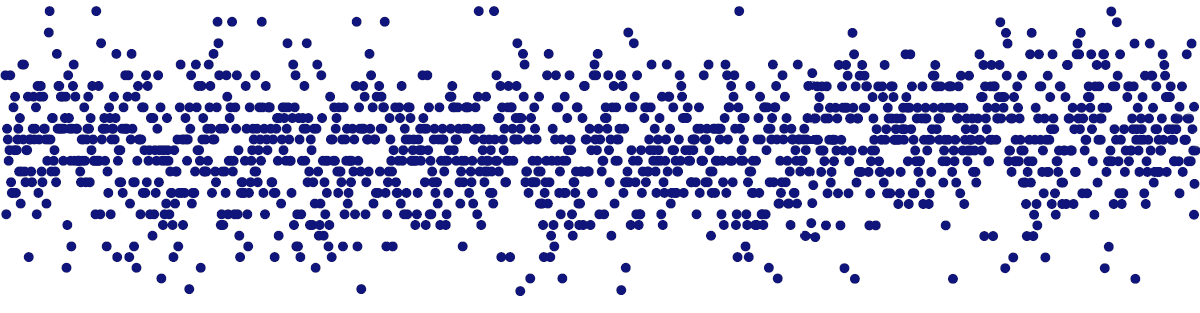
Visualisation of Source Code Repositories
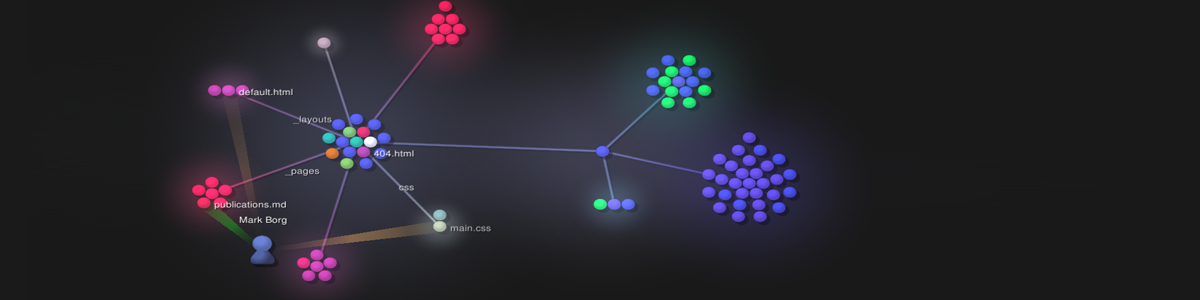
Recently, I needed to do statistical analysis on a source code repository, and in the process, I experimented a bit with freely-available visualisation tools. Here is a cool visualisation of source code submission activity. [read more]
C++/C# interoperability
This is a blog entry on C++/C# interoperability. [read more]
t-SNE and Machine Learning
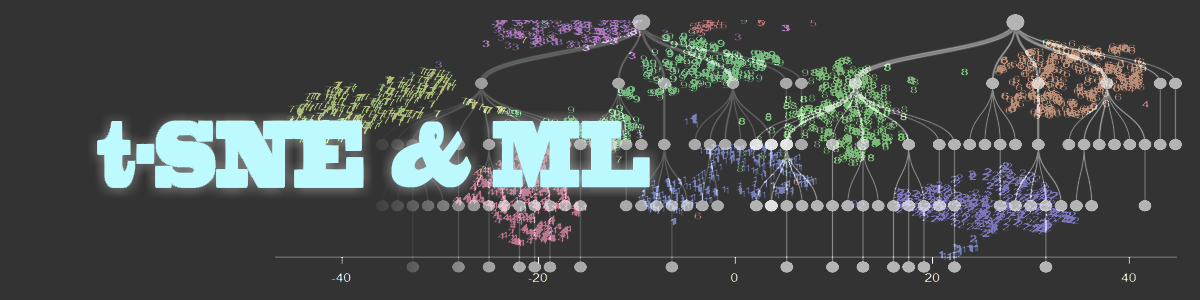
This blog continues on my previous entry on using t-SNE for exploratory data analysis. Now we will consider t-SNE for use within a machine learning system. [read more]
Multi-Dimensional Reduction and Visualisation with t-SNE
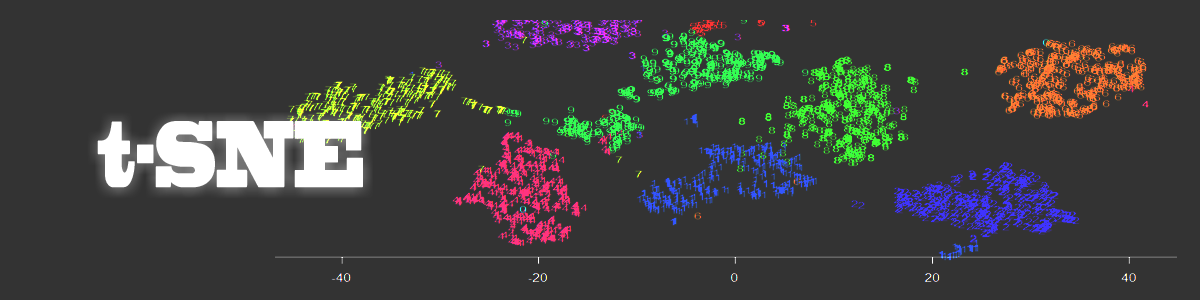
t-SNE is a very powerful technique that can be used for visualising (looking for patterns) in multi-dimensional data. Great things have been said about this technique. In this blog post I did a few experiments with t-SNE in R to learn about this technique and its uses. [read more]
Visualising PV output with 3D Surface Plots
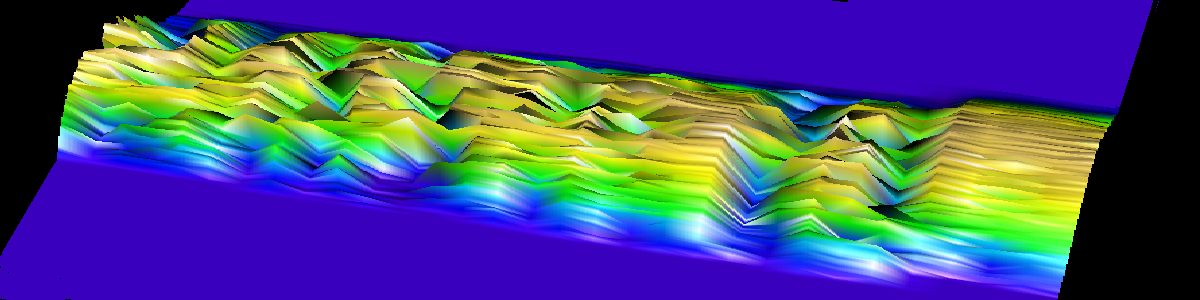
In order to experiment with the 3D plotting functionality of R, I used nearly a year’s worth of power output data from my solar panel installation at home. [read more]
Solving River-Crossing Puzzles with R
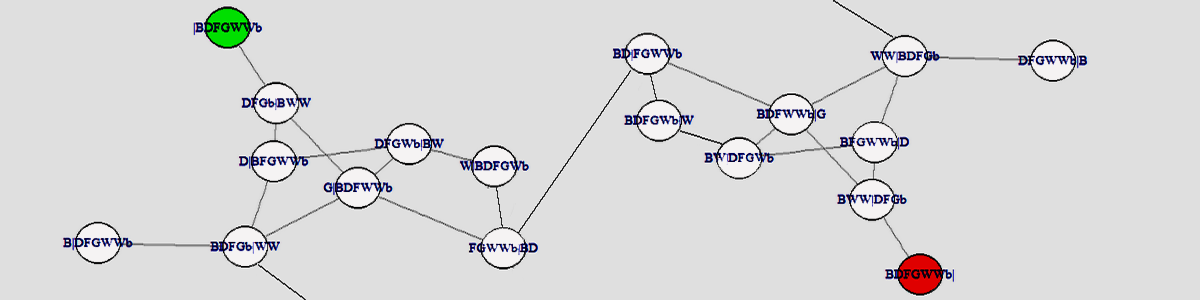
River-Crossing Puzzles are a popular class of puzzles in the field of AI. Many flavours of these puzzles exist. Here we use R to provide a somewhat generic framework to model and solve these type of puzzles. [read more]